Cities don’t keep growing forever. Eventually they become big enough that people get sick of living in them and long to retreat further back into the suburbs. Some never reach that point and simply fizzle out because a major employer leaves town or a river changes course.
Whatever the reasons, cities can lose residents just as easily as they gain them.
With that in mind, here are the 50 American cities that have shrunk the most since 2010.
Big thanks to Business Insider and 24/7 Wall St. for compiling the census data.
Note: some of these “cities” are in fact counties, since the government has amalgamated urban areas for statistical purposes.

50. Fairbanks, Alaska
City population: 31,644
How many people moved out (2010-17): 7,011
Fairbanks is the second-largest metro area in Alaska after Anchorage, but that hasn’t stopped a large percentage of its population from seeking greener pastures in the past decade. In 2010, Fairbanks was named the third most dangerous city in America for women, so maybe that’s part of the explanation. Either that or winter.

49. Johnstown, Pennsylvania
City population: 19,447
How many people moved out (2010-17): 7,070
Johnstown was once a prototypical industrial city, with tens of thousands of jobs in the steel manufacturing industry. Unfortunately, the changing economy and the area’s relative remoteness from iron ore deposits ultimately led to the decline of the old ways.
In 2003, Johnstown was the city in the U.S. that attracted the fewest new residents. Things have improved slightly since then, but the population is still declining.

48. Hinesville, Georgia
City population: 32,872
How many people moved out (2010-17): 7,171
The city of Hinesville is located on Georgia’s Atlantic coast. If that sounds romantic, well… Last year, Business Insider ranked Hinesville the most boring city in Georgia, noting that it has no museums, sparse cultural institutions, not nearly enough restaurants for a city its size, and only four bars.

47. El Centro, California
City population: 42,598
How many people moved out (2010-17): 7,219
El Centro lies near the U.S.-Mexico border in the southeastern part of California, and is Cher’s hometown.
(Fun fact)! Like Cher, however, many people have been leaving El Centro in the past ten years. It’s difficult to say why, though the city was hit hard by the recession of 2008, reaching a peak unemployment rate of 25.
7% in the aftermath.
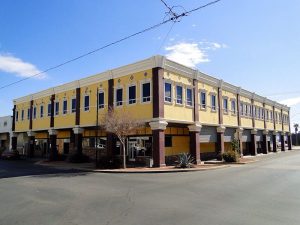
46. Bakersfield, California
City population: 347,483
How many people moved out (2010-17): 7,314
Although the population of Bakersfield is going up overall, the number of people who move away is also surprisingly high. It’s hard to say why, although we note that Bakersfield is one of the least educated major cities in America.
Fewer than 15% of adults have bachelor’s degrees of higher. So perhaps people are moving away to go to school? Who can say?
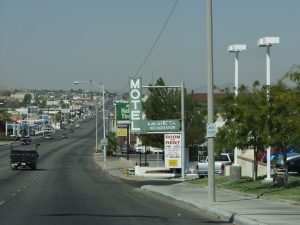
45. Norwich, New London, Connecticut
Metro population: 274,055
How many people moved out (2010-17): 7,365
Norwich is a lovely city with a long history. In fact, according to the Oxford Dictionary, the first use of the word “hello” was in the Oxford Courier in 1826. It’s hard to say why folks are moving away; perhaps it has to do with the larger-scale trend of Americans moving to warmer climates in recent years.

44. Fresno, California
City population: 530,093
How many people moved out (2010-17): 7,571
Fresno is the largest inland city in California, at the heart of the San Joaquin Valley. As one of the most affordable cities in the state, one may well wonder why so many people choose to move down the road?
More likely than not, the reasons are economic, as Americans must move more than ever before to find work that suits them and pays the bills.

43. Macon, Georgia
County population: 153,095
How many people moved out (2010-17): 7,877
Macon is a consolidated city-county area in the heart of Georgia. Despite being a major center, its population has a long history of decline; between 1970 and 1980 it shrunk by 8.
8%, and between 1980 and 1990, it shrunk by 8.8% again. The median income in Macon is almost $20,000 per year less than elsewhere in Georgia, so it’s a safe bet people are leaving to find more lucrative work elsewhere.

42. Anchorage, Alaska
City population: 291,826
How many people moved out (2010-17): 8,464
Who would ever leave a city with a mountain view like Anchorage has? A lot of people, apparently.
Why they leave is a mystery to us, since no one really tracks that. The median family income in Anchorage is more than $85,000, and if you love the great outdoors you couldn’t ask for a better city to call home.
Maybe folks just get tired of the isolation and beat a hasty retreat to the lower 48? Who knows.

41. Cumberland County, New Jersey
County population: 150,972
How many people moved out (2010-17): 8,476
Cumberland County (AKA Vineland-Bridgeton) has lost about 3.8% of its population since 2010.
Almost 20% of the county’s population is under 18, and young people are moving to larger cities, as experts have noted. Perhaps that accounts for the steady flow of residents out of counties like Cumberland.

40. Erie, Pennsylvania
City population: 96,471
How many people moved out (2010-17): 8,511
The situation is dire in Erie, which has lost 5.2% of its population since 2010. In fact, since the 1960s, Erie has lost about 40,000 people.
The reason is the loss of manufacturing jobs, a trend we see across the United States.
A phoenix from the ashes, however: Erie has taken steps to welcome refugees from oversees to help augment its dwindling population.
These days, bout 20% of residents here come from a refugee background.
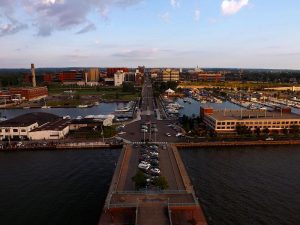
39. Mobile, Alabama
City population: 189,572
How many people moved out (2010-17): 8,517
Mobile has lost about 2.8% of its population since 2010, and about 11,000 people since 1980.
It’s hard to say why so many folks are moving out of Mobile, as it remains one of the cultural centers in the Gulf cost and the most important port in Alabama.

38. Atlantic County, New Jersey
County population: 265,429
How many people moved out (2010-17): 8,550
Atlantic County is the home of the famous (or infamous) Atlantic City. Although the population has been growing steadily for decades, it has fallen by 3.
3% since 2010. Perhaps the decline is related to Atlantic City’s waning popularity as a tourist destination.

37. Fayetteville, North Carolina
City population: 209,468
How many people moved out (2010-17):8,741
Fayetteville is home to Fort Bragg, a substantial and well-known U.S.
Army base. But that hasn’t been enough to keep many people around. As you might expect, the Department of Defense is the biggest local employer.
Those good, recession-proof jobs make Fayetteville attractive for some, but perhaps less so for those who aren’t interested in enlisting.

36. Jacksonville, North Carolina
City population: 72,896
How many people moved out (2010-17): 8,791
Jacksonville’s population is actually growing very quickly overall because of high birth rates and low death rates… but lots of people are leaving as well. Perhaps it has to do with the low median incomes — less than $20,000 per year.

35. Yakima, Washington
City population: 93,884
How many people moved out (2010-17): 8,916
Yakima is a smallish city in central Washington. It has developed a burgeoning winery scene in recent years, and the surrounding areas produce more than 75% of the hops grown in the United States.
And yet people still leave! I guess we can’t all be brewers.

34. Binghamton, New York
City population: 44,785
How many people moved out (2010-17): 9,470
Binghampton’s population has been in decline since 1950, when it peaked at more than 80,000. In the past 8 years, the city has lost 5.
5% of its population, which is actually something of an improvement over the decline of previous decades.
Apart from people simply leaving, there are also more citizens dying than being born, and 25% of all households are single persons over 65 living alone.
Sounds like a retirement haven to us.

33. Sierra Vista-Douglas Metro Area, Arizona
County population: 126,770
How many people moved out (2010-17): 9,495
The world’s first McDonald’s drive-thru was located in Sierra Vista. Sadly, many customers seem to keep on driving, as the population has fallen by 3.
5% since 2010.

32. Farmington, New Mexico
City population: 44,788
How many people moved out (2010-17): 9,633
Farmington’s major industries are petroleum and coal. Perhaps the collapsing coal market is one of the reasons why the city’s population has fallen by 2.
4% since 2010.
Interestingly, Farmington was also the site of a mass UFO sighting back in the 1950s in which nearly half the town claimed to have seen several flying saucers.
Maybe some of the residents have merely relocated to another star system.

31. Lawton, Oklahoma
City population: 92,859
How many people moved out (2010-17): 9,641
Lawton has lost 4,000 people since the last census. The reason is perhaps that Lawton has an alarmingly high crime rate — 56 per 1,000 residents.
Lawton residents have a 1 in 22 chance of being the victim of a property crime.

30. Charleston, West Virginia
City population: 47,215
How many people moved out (2010-17): 9,772
Charleston has been in decline since 1970. In that time, the population has fallen from 71,000 to fewer than 50,000.
Sadly, this is a trend across West Virginia in general. Economic depression seems to be the greatest overall reason, but in Charleston low birth rates and high death rates are also a major factor.

29. Saginaw, Michigan
City population: 48,323
How many people moved out (2010-17): 9,783
Saginaw’s population has been approximately halved since 1970, mostly a result of deindustrialization (we’re sensing a theme here). The accompanying rises in unemployment and crime have driven people out of the city itself and into the more suburban surrounding areas.
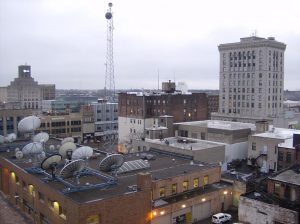
28. Pine Bluff, Arkansas
City population: 42,271
How many people moved out (2010-17): 10,001
Pine Bluff is a largely agricultural region. The most likely reason its population has collapsed by an astonishing 13.
9% in the past 8 years is poverty. Nearly a third of the population in Pine Bluff lives below the poverty line, making it one of the poorest cities in America.
The median home value here is less than $85,000.
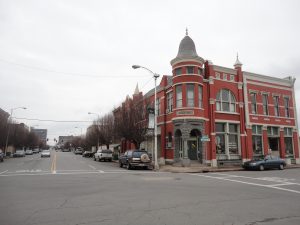
27. Montgomery, Alabama
City population: 198,218
How many people moved out (2010-17): 10,317
Montgomery is the capital of Alabama, and the second largest city in the state. However, its population has begun to shrink in the past decade (3.
7%), despite the great efforts that have been made at revitalization. The reason is perhaps lack of opportunity; more than a third of children here are raised below the poverty line.
That might just be enough to inspire young people to make their futures further afield.
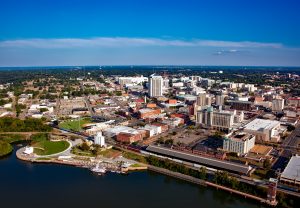
26. Wichita, Kansas
City population: 389,255
How many people moved out (2010-17): 10,335
Wichita’s population is growing overall, but plenty of people leave as well. Most likely, it’s part of the larger trend of Americans moving to the coasts and warmer climates, since Wichita has quite a lot to offer in itself.

25. Watertown-Fort Drum, New York
City population: 114,006
How many people moved out (2010-17): 10,901
The city of Watertown has lost 6.4% of its population since 2010.
Interestingly, the city makes a number of claims for itself:
according to legend, the five-and-dime store and the safety pin were both invented here. Watertown is also home to the oldest annual county fair in America.
I guess some people are never satisfied.
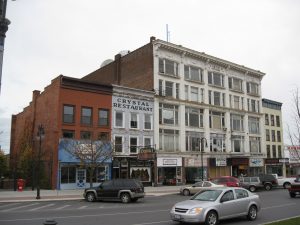
24. Albany, Georgia
City population: 75,249
How many people moved out (2010-17): 10,964
Albany first came to prominence in the 19th century as a trading hub on the Flint River. These days, alas, it is a hub of poverty.
About 40% of the population here lives below the poverty line, and about 55% of children do as well. It’s actually a wonder the population hasn’t shrunk by more than 2.
8% in the past decade.
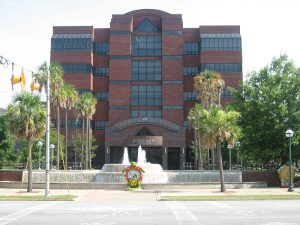
23. Greater New Haven, Connecticut
Metro population: 862,477
How many people moved out (2010-17): 11,253
Greater New Haven includes the historic city of New Haven itself as well as the surrounding areas.
Like many other cities, New Haven suffered losses of manufacturing jobs in the later 20th century that hollowed out its neighborhoods.
Today, the biggest employer here is the world-famous Yale University. Even with such prestigious institutions, the city and metro area just isn’t what it once was in terms of population.

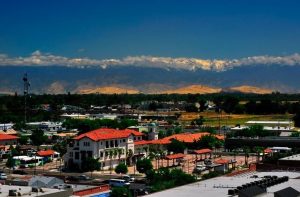
22. Visalia-Porterville, California
County population: 465,861
How many people moved out (2010-17): 12,390
Visalia-Porterville is Tulare County, where about a third of the population receives welfare. Part of the reason so many people are leaving (even though the overall population is on the rise) is because the city is paying them to move where jobs are more plentiful.
21. Shreveport-Bossier City, Louisiana
Metro population: 440,933
How many people moved out (2010-17): 12,410
Shreveport-Bossier is an amalgamated metropolitan area. Interestingly, while Bossier is growing, Shreveport has entered a serious population downturn, shedding 5.
2% of its population since 2010. The most likely reason for this is a downturn in the oil industry, which has always been a cornerstone of the city’s economy.

20. Greater Hartford, Connecticut
Metro population: 1,210,259
How many people moved out (2010-17): 13,682
The city of Hartford proper has shrunk considerably since 1950, losing more than 50,000 residents in that time. Despite its status as the Mecca of the world insurance industry, unemployment in Hartford remains quite high, which is probably why so many people are deciding to skip town.

19. Greater Youngstown, Ohio
Metro population: 541,926
How many people moved out (2010-17): 14,057
Youngstown is the heart of the rustbelt, so you can guess why its population has dropped by more than 4% in the past eight years. This used to be the heart of steel country, but now you’ll find more scrap metal yards than working factories.
Since 1960, the population has declined by about 60%. In 2007, Youngstown recorded the lowest median income for any city with more than 65,000 people. The city has 20 times more vacant houses than the national average.

18. Peoria, Illinois
City population: 111,388
How many people moved out (2010-17): 14,415
Will it play in Peoria?
This Illinois city is best known for housing the headquarters of tractor manufacturer Caterpillar.
Or, rather, it was until 2018, when the company decamped to Deerfield, Illinois. That seems likely to lead to further depopulation, since Caterpillar was the biggest employer in town.

17. Kings County, California
City population: 151,366
How many people moved out (2010-17): 14,442
Kings County shrunk for the first time in its history over the past eight years. Interestingly, this region in central California has the highest incarceration rate in the state — 1,384 per 100,000 residents.
Alarmingly, that’s more than double the average.

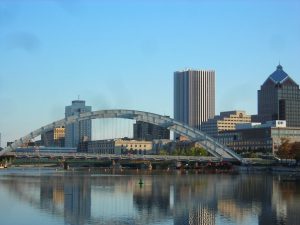
16. Rochester, New York
City population: 206,284
How many people moved out (2010-17): 15,934
It’s a bit bizarre that Rochester’s population is contracting, since it’s a traditional home for new immigrants and refugees. However, perhaps some folks are looking to relocate because of the crime problem in Rochester; the city’s reported crime rate is almost 4 times the national average for a community of its size.
15. Brownsville-Harlingen, Texas
Metro population: 415,557
How many people moved out (2010-17): 17,233
Brownsville-Harlingen is an amalgamated metropolitan area in the Rio Grande Valley of South Texas. There’s no mystery why residents are doing all they can to escape; the region has some of the worst poverty in the United States, with 29% of households relying on food stamps to make end’s meet.
Only 64% of adults have graduated high school.

14. Hampton Roads, Virginia/North Carolina
Metro population: 1,728,733
How many people moved out (2010-17): 17,297
Hampton Roads is a large metro area that comprises many communities — perhaps most famously colonial Williamsburg. Although the population is growing overall, many people are also moving away.
Of course, that’s to be expected in any populated area.

13. Syracuse, New York
City population: 142,749
How many people moved out (2010-17): 17,717
Syracuse is the most important city in central New York, but its population has been slowly dwindling for decades. Since 1960, it has fallen by more than 60,000.
Most likely, many people are leaving Syracuse proper to live in the surrounding suburbs. Poverty in the city itself is quite bad, with more than 35% of households living below the poverty line.

12. Toledo, Ohio
City population: 274,975
How many people moved out (2010-17): 18,475
Toledo has lost some 14,000 residents since 2010, but this is just a small part of a longer term trend. In the last half of the 20th century, deindustrialization laid waste once great cities like Toledo.
Most people with money fled to the suburbs. 25% of the city has vanished since 1970, despite revitalization efforts to attract residents back to town.

11. Rockford, Illinois
City population: 146,526
How many people moved out (2010-17): 18,789
After decades of growth, Rockford has suffered a 4.2% dip in population since 2010. The main reasons are high unemployment and high crime.
USA Today recently rated it the 16th worst American city to live in for those reasons, and residents appear to be taking note and tucking tail.

10. New York Metropolitan Area
Metro population: 21,045,000
How many people moved out (2010-17): 21,503
With such a huge number of people living in an urban sprawl, a bunch of them are bound to move away. Truth be told, it’s a wonder more people haven’t decided to move to Santa Fe or something.

9. El Paso, Texas
City population: 682,669
How many people moved out (2010-17): 21,829
El Paso is a great city whose problems are not especially serious relative to some other entries on this list, so it’s difficult to say why so many people are moving away. Maybe some are seeking more affordable places to live?
Who can say?

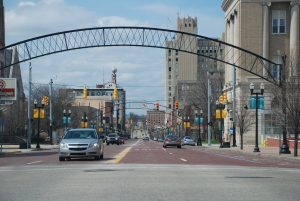
8. Flint, Michigan
City population: 95,943
How many people moved out (2010-17): 22,658
This one isn’t a surprise, but an American tragedy.
Between 1978 and 2010, GM cut its workforce in the flint area by 90%.
The city has never rebounded. The population of has halved in recent decades as its citizens fled from unemployment, crime, mismanagement, and undrinkable water. Alas, Flint has become the poster child for the decline of the American industrial city, and there’s no end in sight.
7. Milwaukee Metropolitan Area, Wisconsin
Metro population: 1,576,236
How many people moved out (2010-17): 27,959
The region itself is growing, but many people are also looking to start their lives over elsewhere. The city of Milwaukee itself has not been immune to the problems that plague many medium-sized cities surrounded by suburbs — namely the tendency of wealthier people to move out of urban areas, destroying the tax base and creating a self-perpetuating cycle of deterioration.
But the problem isn’t nearly as serious as elsewhere in the U.S.

6. Memphis, Tennessee
City population: 650,618
How many people moved out (2010-17): 30,000
Memphis is, of course, one of America’s great city, a giant of music and history. Unfortunately, it has also suffered from a number of problems.
In 2011, it was named the poorest major city in America. As with other such cities, the money tends to accumulate in the suburbs, leaving the core itself to decay.
Crime has also been a major concern in Memphis of late, though it has been falling steadily.

5. Cleveland Metropolitan Area, Ohio
City population: 2,058,844
How many people moved out (2010-17): 33,117
The story of Cleveland is much the same as other large formerly industry-heavy cities, although there is actually great wealth in the areas surrounding the city and things are not so bad as they once were. The reality is that more people than ever are willing to move to find good-paying work, and if they can’t find that in Cleveland, they will go elsewhere.

4. St. Louis, Missouri
City population: 302,838
How many people moved out (2010-17): 39,894
It’s no mystery why people are leaving St. Louis: crime is out of control. Violent crime in particular is very much on the rise, and St.
Louis is, lamentably, the new ‘most dangerous city in America’. In 2017, there were 205 murders in this city of 300,000, making it comparable to Detroit, which has a much larger population.

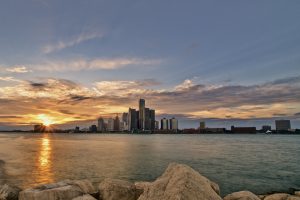
3. Detroit Metropolitan Area, Michigan
Metro population: 4,313,002
How many people moved out (2010-17): 54,640
Speak of the devil.
Believe it or not, Detroit has actually started to grow again — albeit slowly.
But nothing can undo the ruination that the past decades have visited on the city that was once (literally) the engine room of American industry.
Deindustrialization, crime, urban rot, corruption, mismanagement: all have eaten away at Detroit, leaving those who love and live in the city to rebuild as best they can.
Let us hope that brighter days lie ahead.
2. Los Angeles Metropolitan Area, California
Metro population: 13,353,907
How many people moved out (2010-17): 93,959
Much like New York, L.A. is an enormous city and it is in the nature of enormous cities that people come and go.
Rest assured, the city grew about 4% in the past 8 years. It will still be there 8 years from now, bigger and better than ever.
But who could blame certain folks for wanting to escape the air pollution, crime, and noise in favor of a quieter spot down the coast?

1. Chicago Metropolitan Area, Illinois
Metro population: 9,533,040
How many people moved out (2010-17): 296,320
Chicago gets a bad rap for being infested with crime. Indeed there is gang violence here, as there is in every major city, but it’s actually much lower per capita than in many other cities.
In recent years, Chicago has failed even to crack the top 20 in terms of murders per capita in U.S. cities, despite its fearsome reputation.
More likely Chicagoans are leaving town for the same reasons most Americans move: to find work, more affordable housing, and a better climate.


